Why is Particle Size Distribution Important?
Tightly controlled particle size distributions are highly important for pharmaceutical drug development. Powder particle size distribution is a valuable indicator of quality and performance. After all the hard work is done to research and develop a new pharmaceutical drug, the next step towards manufacturing is to identify the best way to get the new active pharmaceutical ingredient (API) into a suitable dosage form.
The flowability and ease of handling of the API and excipients (fillers and lubricants) are key requirements for the drug formulation. Dissolution rates, uniformity and consistency of the drug content are the most important parameters for drug effectiveness, quality, and most importantly, bioavailability. Bioavailability is a term used in pharmacology, referring to the degree and rate at which an administered drug is absorbed by the body’s circulatory system.
The impact that pharmaceutical particles and powders have on bioavailability and performance is tested and evaluated at several different phases during the development of all drugs. Once the impact has been analyzed during the final development phase, target particle size distribution specifications are determined to control manufacturing consistency and drug product quality.
Formulations are a very important aspect of creating medicines since they are essential to ensuring that the active part of the drug is delivered to the correct part of the body, in the right concentration, and at the correct rate (not too fast or too slow).
What is Particle Size Distribution?
Particle size distribution is a measurement that defines the number of particles present according to their size. As you can see in Figure 1, spherical particles are described using the particle’s diameter as a single number, as all the dimensions are identical. However, not all particles in a sample of powder are perfectly spherical. These non-spherical particles are described using multiple length and width measurements (vertical and horizontal projections are shown in Figure 1).
%20copy.webp?width=500&name=Quadro%20Blog%20TOFU%203_images_figure01%20(1)%20copy.webp) Figure 1: Measuring a spherical particle (left) and an irregular particle (right).
Figure 1: Measuring a spherical particle (left) and an irregular particle (right).
These descriptions of the non-spherical particle provide higher levels of accuracy but involve greater complexity in their measurement. Therefore, most methods make the assumption that every particle is a sphere and the reported value is expressed using the equivalent spherical diameter.
In order to represent the size range (or particle size distribution), a frequency diagram or histogram is produced (see Figure 2 below). The x-axis records the particle size and the vertical height (y-axis) represents the number of particles at that size (or in other words,
When manufacturing pharmaceuticals, it is the width of the distribution curve that is of most importance. The key measurements that we use in setting up the Quadro Mills is to cite three values—the D10, D50 and D90 as shown in Figure 2. The D50, the median, is defined as the particle size where half the population lies below this value. Similarly, 90 percent of the population lies below the D90 point, and 10 percent of the population lies below the D10.
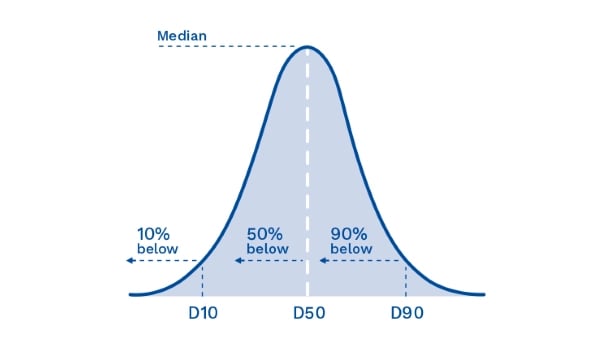 Figure 2: How D-values are measured according to the three-axis values
How Varying Particle Sizes Can Affect Pharmaceutical Manufacturing
During the development and manufacturing of pharmaceutical drugs, determining particle size distributions and making sure they remain consistent is vitally important to ensure the absorption rates of the APIs. In addition, particle sizes that are off-spec can slow down production or reduce yields and affect overall profitability.
For example, flowability is very important during tablet manufacturing and it is common knowledge that the smaller the particle, the worse the flow. For example—using sugar as an illustration—powdered sugar exhibits better dissolution but granulated sugar flows much more easily. Reduced or inconsistent flow when discharging to the tablet press can cause quality issues including variation in tablet weight and content uniformity during the compression stages.
Particle compressibility is also very important. Very fine particles have less ability to lock together under compression. When using a tablet press and working with very fine particles, it takes additional steps to maintain a good quality product because of the lack of ability of the smaller particles to compress together.
When working with very fine particles during tablet compression, pre-compression is often needed — the operator uses an initial compression at a lighter pressure first, ahead of the main compression step. If pre-compression is not carried out, it can lead to problems during normal compression known as Capping or Lamination. Capping is when the upper or lower part of a tablet separates horizontally as the tablet press ejects the tablets (see Figure 3, below left). Lamination is single or multi-layer separation that occurs at any other part of the tablet except the top or bottom (see Figure 3, below right).
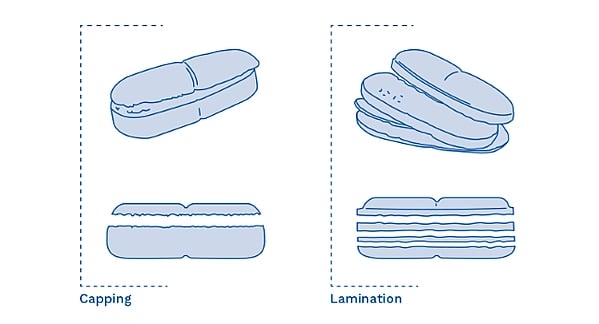 Figure 3. Examples of tablet compression defects known as Capping (left), and Lamination (right).
The creation of fines (small dusty particles) during production increases manufacturing operation running costs because these fines become wasted product in the form of dust that cannot be re-utilized, thereby reducing the overall product yield.
Fines are generated by inaccurate product handling, incorrect milling setup, or other particle size reduction techniques. In addition to reducing yield, fines cause an increased need for cleaning the working environment, and higher levels of machine and tool wear, which all further negatively affect profitability.
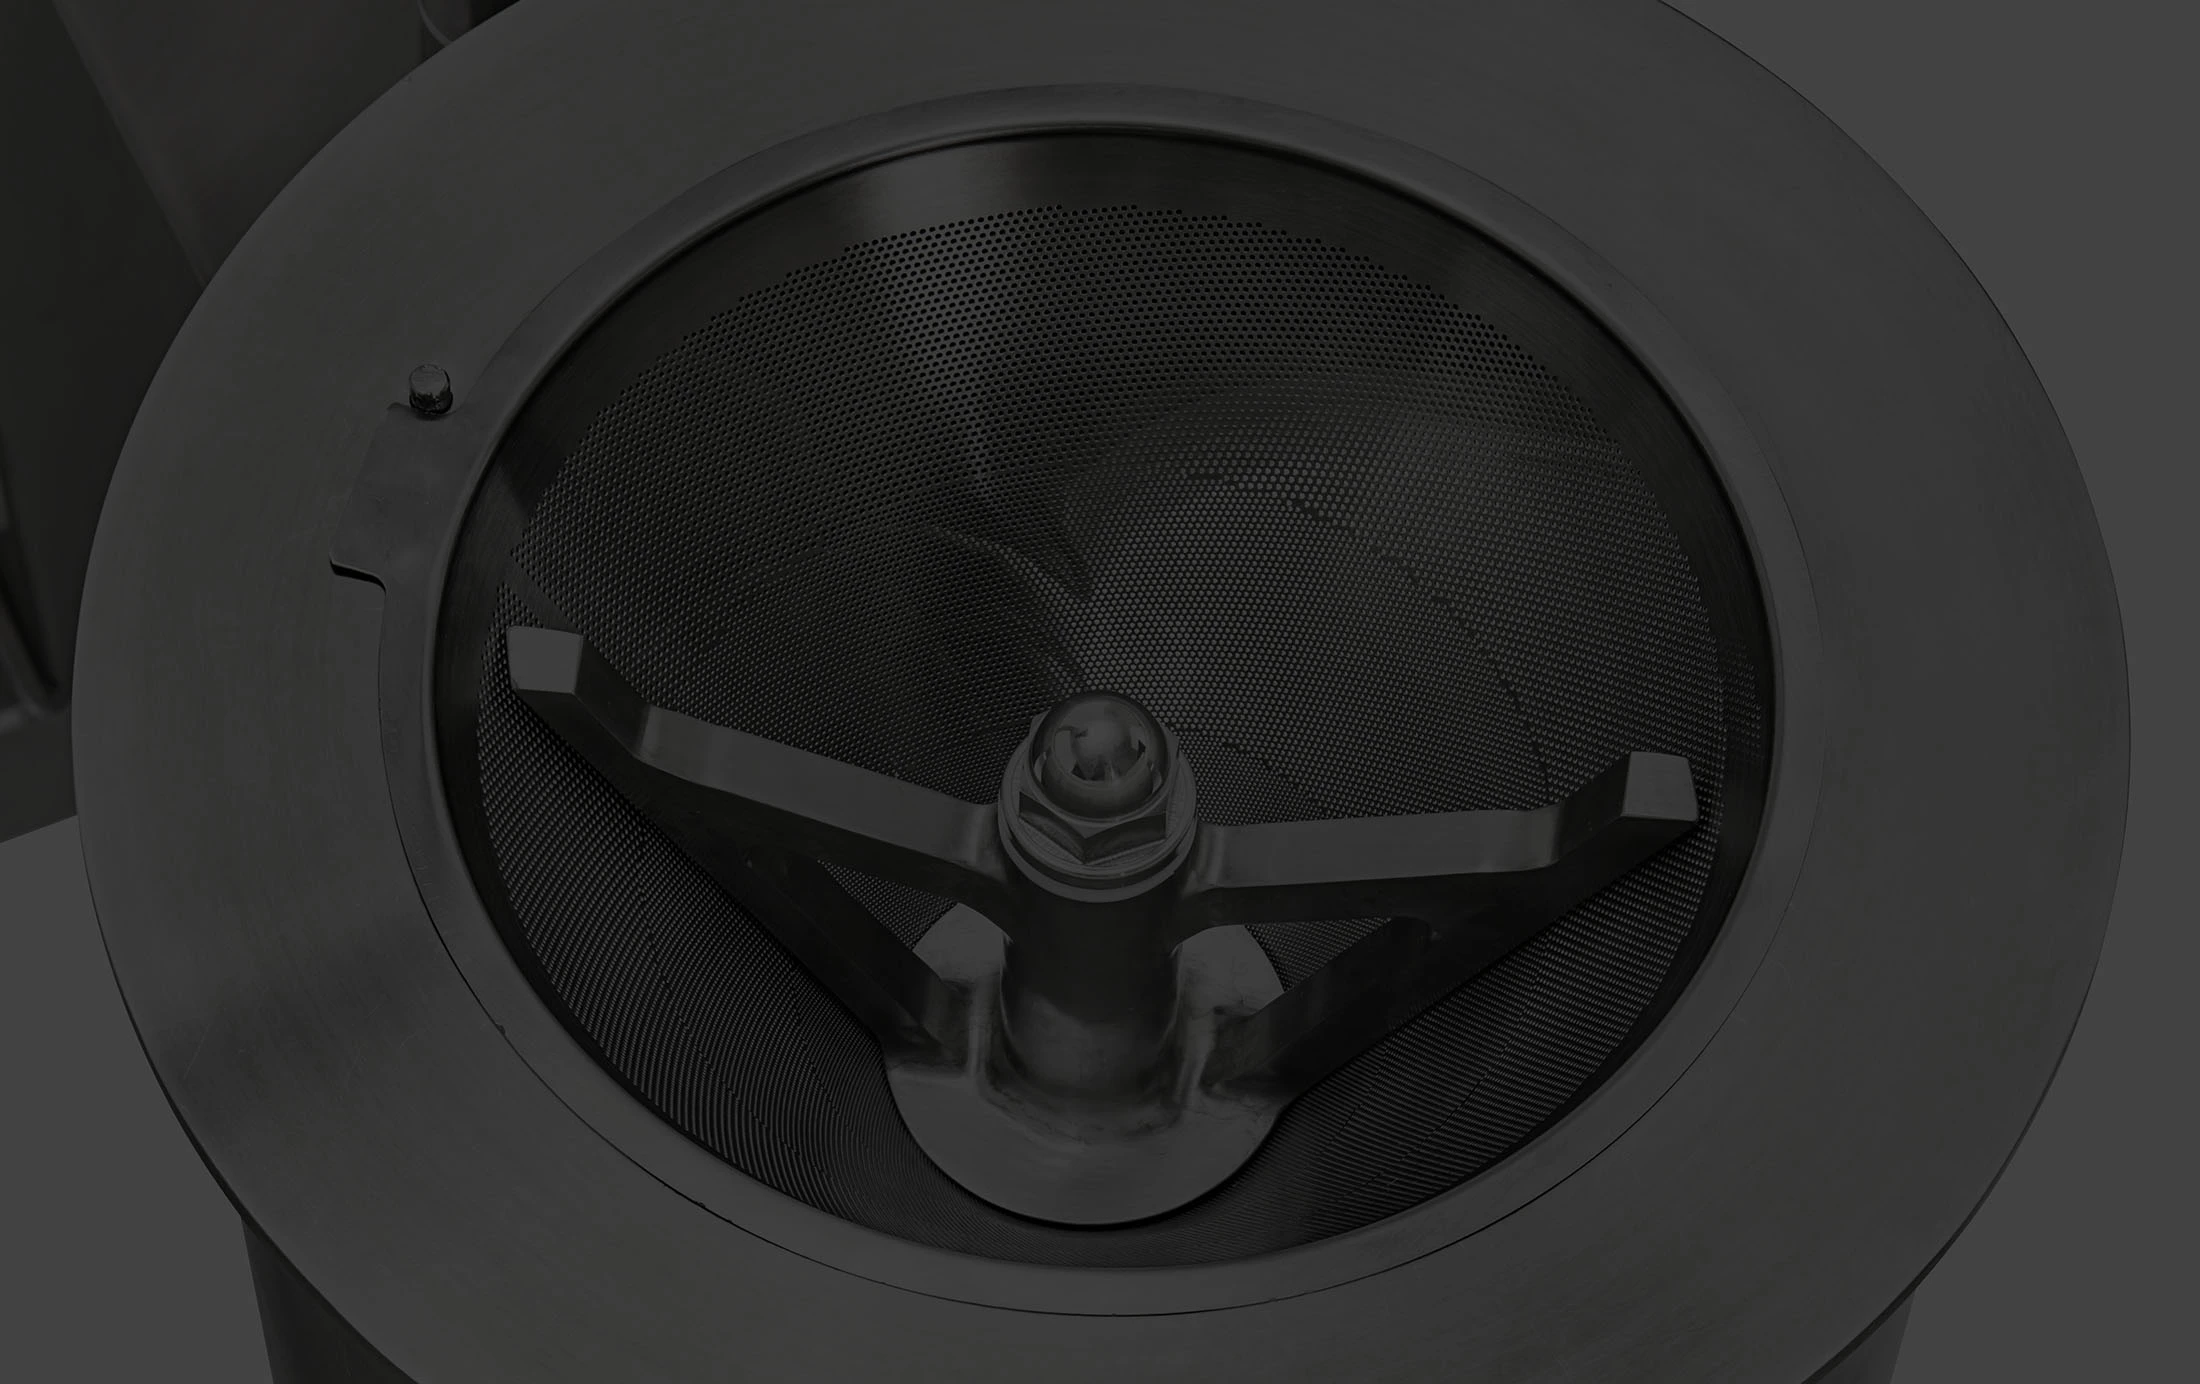
Achieve Precise Target Particle Size Distributions With Conical Mills or Hammer Mills
The analysis of particle size distribution is an important parameter for FDA process validation. The narrower the particle size distribution range, the more product there is being produced that meets the exact particle size specifications for formulation and bioavailability.
Both Conical Milling and Hammer Milling are successfully used to regulate particle size and shape, and achieve consistent tight particle size distributions, leading to quality products and efficient production systems.
The choice of whether to use Conical Milling or Hammer Milling will be decided by several factors including an evaluation of the type of product that needs to be processed, and the results required.
Choosing the Right Mill to Achieve Target Particle Sizes
Not sure which mill or screen setup is right for your product?
Learn how to select the correct screen type and impeller with the Quadro and Fitzpatrick Particle Sizing Card.

Controlling the particle size distribution of your materials will not only improve the production workflows, but also result in a higher quality end product with the expected bioavailability, dissolution, and validated effectiveness required for drug production.
Learn more on our website pages about Conical Milling equipment from Quadro Engineering, or Hammer Milling equipment from Fitzpatrick.
If you would like a demonstration of our pharma milling equipment, please contact us and we’ll put you in touch with a local sales engineer. You can also read related articles for best practices and advice on particle size reduction here.